Personal website
This site. Server-rendered pages, built as a container and deployed on every push to main — the commit in the footer is the one running.
Somewhere to point people at, and to keep the CV current.
- Next.js
- React
- TypeScript
- Tailwind CSS
- Amplitude
- Docker
- Terraform
- AWS EC2
- Amazon ECR
- GitHub Actions
- Caddy
- Cloudflare DNS + proxy
- pnpm monorepo
Updated September 2026
What makes it interesting
- It reports on itself: a live stats page reads the site's own analytics back from Amplitude and charts them.
- Server-rendered by default: every page but the stats page is prerendered at build time. The only code that runs in the browser is the nav's active state, the copy button, and analytics.
- A push to
mainis the whole release process — no SSH, no long-lived AWS keys. - The footer shows the commit that's running. The same SHA goes to Amplitude as
app_version, so behaviour can be compared release by release. - Content is typed data in the code, and typed routes turn a broken internal link into a build error.
- Decisions are written down as public architecture decision records, and every push is checked (lint, types, tests and a screenshot of every page) before anything deploys.
Architecture
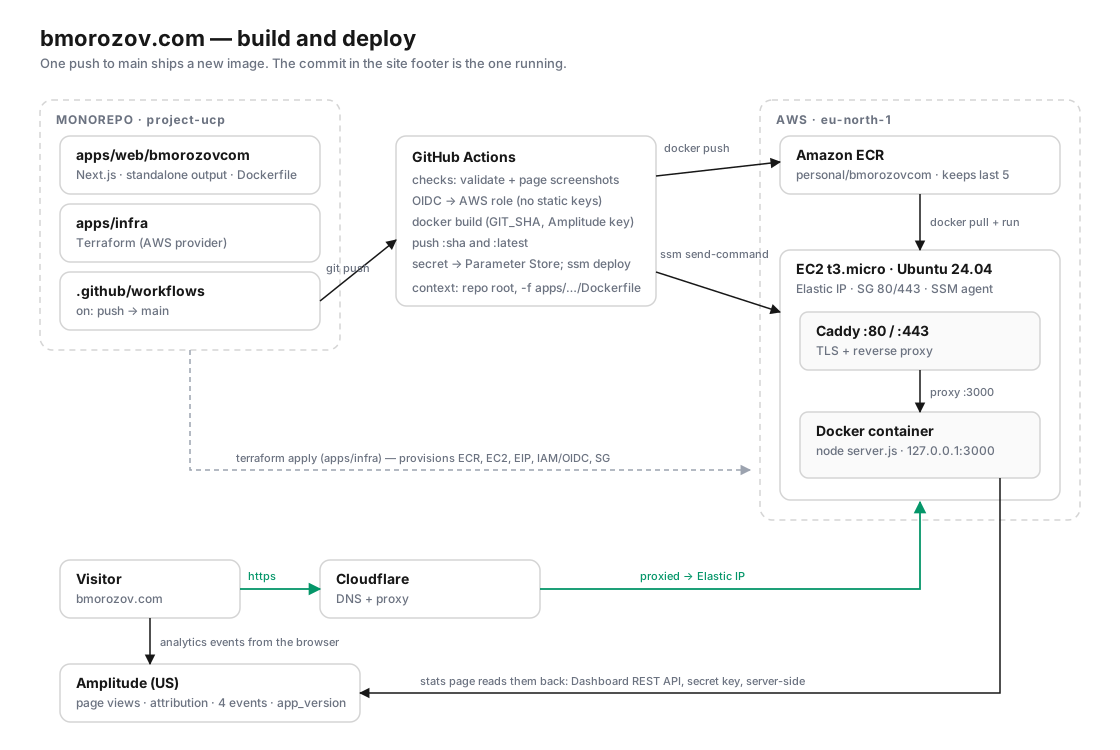
Delivery pipeline
- A push to
maintriggers GitHub Actions. The checks run first: formatting, types, lint, the few unit tests, the decision records and the code structure, then a screenshot of every page compared with its approved one. Anything red stops the deploy. - Once they pass, the deploy job assumes an AWS role through OIDC.
docker buildruns from the repo root with the app's own Dockerfile, baking in the commit SHA and the Amplitude key. Next.js standalone output keeps only the server and the modules it traces.- The image is pushed to Amazon ECR as
:shaand:latest; a lifecycle policy keeps the last five. - SSM Run Command tells the EC2 host to pull the image and restart the container. The Amplitude secret key the stats page reads with goes the long way round: from a GitHub secret into Parameter Store, encrypted, and from there to the container at start — never into the image or the deploy command.
- Caddy on ports 80 and 443 proxies to the container on
127.0.0.1:3000. Cloudflare sits in front for DNS and proxying.
Infrastructure
Everything on AWS is Terraform, in apps/infra:
- EC2
t3.microon Ubuntu 24.04 with an Elastic IP. The security group opens only 80 and 443 — access is through SSM. - An instance role that can read from ECR, be managed by SSM, and read its one secret from Parameter Store.
- The ECR repository and its lifecycle policy.
- A GitHub OIDC provider and a deploy role scoped to this repository.
- cloud-init that installs Docker, the AWS CLI and Caddy.
Analytics
Amplitude, with the context left to Amplitude: autocapture records page views, sessions and campaign attribution; every event is enriched with the current and previous page; location and device are resolved on Amplitude's side. The site only sends what Amplitude can't infer:
| Event | Fires when | Properties |
|---|---|---|
contact_clicked | A contact card is opened, or its handle copied | type, action |
cv_downloaded | The CV is downloaded | cv_version |
project_clicked | A project link is followed — page, live site, stats, diagram or source | project, destination, url |
architecture_diagram_viewed | The architecture diagram page is seen, however it was reached | project |
No cookies or local storage, and Session Replay is off, so there is no consent banner. Local and test builds report to a separate Amplitude project from production.
Live stats
The same events come back out on a public stats page: page views, CV downloads and contact clicks per channel. The server queries Amplitude's Dashboard REST API — so the secret key never reaches the browser — and draws the charts as plain server-rendered HTML and CSS, with no charting library.
Freshness is Amplitude's call: it caches query results itself, for about five minutes on hourly queries and hours on daily ones. So the default view is the last 24 hours in hourly buckets, and every range says how fresh it is.